Contingency Table (Machine Learning) : Everything you Need to Know
Contingency tables are an essential tool in statistics, frequently used to summarize the relationship between several categorical variables simultaneously. By listing multiple variables and their frequencies in a simplified manner, researchers can effectively explore and draw conclusions from complex datasets. In this blog post, we will explain everything you need to know about contingency tables, from their structure and use cases to their various applications in machine learning and beyond.
Digging Deeper: Contingency Table Components and Attributes
Contingency tables serve as a valuable resource for understanding the intricate associations among categorical variables. To fully appreciate their utility, let’s delve into the key components and attributes that make up a comprehensive contingency table.

Joint Frequencies: Also known as cross-tabulated frequencies, joint frequencies represent the number of observed cases in which the values of two categorical variables coincide. In a contingency table, the cells contain these joint frequencies, thereby describing the interrelations between the variables. This allows for the visualization of patterns and trends within the dataset, facilitating data-driven decision making.
Marginal Frequencies: The marginal frequency represents the total count of observations for a specific value, either within a row or column. They assist in evaluating the distribution of each variable, enabling the identification of the most dominant categories. Calculating the row and column percentages, or the proportional share of a particular category, can further assist in comparing relative frequencies across variables.
Conditional Probabilities: Contingency tables can also be employed to calculate conditional probabilities, which denote the likelihood of an event A occurring, provided that event B has occurred. By calculating conditional probabilities, researchers can identify potential patterns in the relationships between categorical variables. This can serve as the basis for further investigation, including the application of machine learning algorithms and predictive modeling techniques.
Note: The chi-square test is a statistical test often applied to contingency tables to determine if there is a significant association between the categorical variables. The test is based on comparing the observed frequencies in the table with the frequencies expected under the assumption of independence between the variables.
Visualization: To make sense of large contingency tables, visual representations like mosaic plots and heatmaps can be utilized. Mosaic plots visualize contingency tables as segmented rectangles, where the size of each segment represents the frequency of each category combination. Heatmaps, on the other hand, use color gradients to represent the frequencies in each cell, which can help in identifying clusters and trends in the data more easily.
Contingency tables serve as a powerful tool for illustrating the intricate relationships between categorical variables, providing a foundation from which researchers can analyze data and develop actionable insights. From joint frequencies to visual representations, the various components of contingency tables work together to enable researchers to probe into complex datasets and effectively extract meaningful information.
Exploring the Components and Interpreting Contingency Tables
Contingency tables provide valuable insights into relationships between categorical variables, emphasizing the importance of understanding its components and interpretations. One of the key elements in contingency tables is joint frequencies, which are the observed occurrences of two variables in a specific combination. They help us identify and analyze any patterns or relationships in the data.
Cells in a contingency table represent the joint frequencies of each combination of categorical variables. Each cell thus provides straightforward information about the occurrence of a given pair of variables. By examining these individual cells, one can easily determine the most or least frequent relationships among the categorical variables.
It is crucial to understand row and column percentages in order to compare relationships between variables effectively. Row percentages, derived from dividing joint frequencies by the corresponding row’s marginal frequency, offer insightful comparisons among various subgroups. Similarly, column percentages, calculated by dividing joint frequencies by the matching column’s marginal frequency, deliver valuable information about the distribution of the variable against different analysis points.
To make accurate interpretations and gain valuable insights, both row and column percentages must be considered in the context of the given data.
Another essential aspect of contingency tables is chi-squared tests, which are used to evaluate any significant associations between the categorical variables. This statistical test compares the observed frequencies with the expected frequencies that would occur if the variables were independent. A high chi-squared value indicates a significant association between the two categorical variables, and a low value signifies their independence.
Visual representation of contingency tables can enhance understanding and simplify comparisons. This includes bar charts, mosaic plots, and heatmaps, which transform the table’s numerical data into a more easily digestible visual format. These visualizations can highlight key patterns, trends, and relationships in the data, helping analysts make informed decisions and communicate their findings clearly.
Contingency Tables in Machine Learning
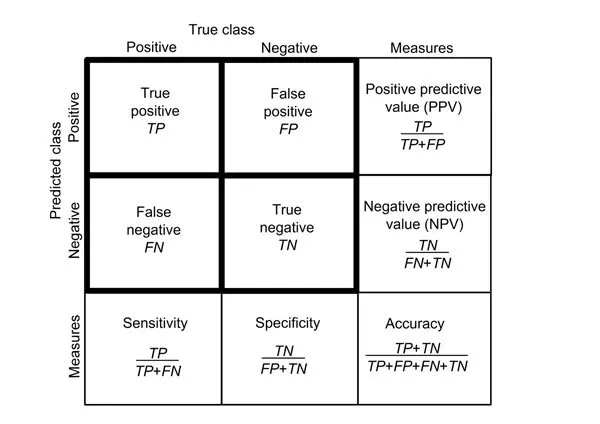
In the realm of machine learning, contingency tables are a valuable tool for evaluating classification models. By comparing the predicted categories with the actual categories, analysts can assess the accuracy and effectiveness of their models. For instance, a confusion matrix – a specific type of contingency table – can be used to visualize classification errors in binary or multiclass classification tasks. Consequently, machine learning practitioners can identify areas of improvement and refine their algorithms accordingly.
Understanding contingency tables’ structure and essential components allows researchers and analysts to grasp the relationships between categorical variables effectively. The ability to interpret these tables accurately, considering row and column percentages, combined with visual representations, is critical for drawing meaningful insights and unlocking the full potential of this powerful analytical tool.
Enhanced Data Visualization and Interpretation with Contingency Tables
One of the most compelling reasons for using contingency tables is their ability to provide an enhanced data visualization, which can improve interpretation and understanding of the relationships between categorical variables. By organizing the data in a clear and coherent manner, contingency tables offer a better overview of any patterns or trends that may not be readily apparent through numerical summaries alone. This enhanced visualization allows researchers and analysts to more accurately interpret the relationships between variables, leading to more informed decision-making and further discovery of new research opportunities.
Contingency Tables in Real-World Applications
Contingency tables are frequently utilized in various industries and fields beyond machine learning. For example, in epidemiology and public health, contingency tables can be used to investigate the prevalence of diseases in different populations or to analyze associations between exposure and health outcomes. In marketing, contingency tables may be essential to consumer segmentation, where customer preferences are studied to identify potential purchasing habits, allowing businesses to tailor their marketing efforts accordingly. Additionally, in finance and economics, contingency tables can be instrumental for identifying risk factors and their impact on asset performance, helping investors make well-informed decisions.
Evaluating the Assumptions with Contingency Tables
Contingency tables can also be useful in evaluating the underlying assumptions behind a statistical model. By visualizing the relationships between predicted and observed outcomes, researchers and analysts can assess whether their statistical models are accurately capturing the true relationships between variables.
This evaluation process is crucial to refine statistical models and enhance their predictive capabilities. If the contingency table reveals violations of model assumptions or inconsistencies in the data, researchers can take appropriate steps to address these issues and improve their overall analysis process.
Contingency Tables as the Basis for Further Statistical Techniques
In addition to chi-square tests, contingency tables serve as the foundation for various other statistical methods that extend the analysis of categorical data. Examples include Fisher’s Exact Test, McNemar’s Test, and Cochran-Mantel-Haenszel Test, among others. These additional statistical techniques can provide more complex analyses, allowing researchers and analysts to draw nuanced conclusions from their data and optimize the decision-making process, depending on the unique requirements of their research or industry.
Advanced Applications of Contingency Tables
Contingency tables have a multitude of advanced applications within the realm of machine learning and statistical analysis. These powerful tools not only provide valuable insights into categorical data but also enable researchers and data scientists to optimize their models and discover hidden relationships between variables. Some notable advanced applications are:
1. Model Evaluation: Contingency tables, when employed as confusion matrices, help assess the performance of classification models in machine learning. By comparing the predicted outcomes to the actual outcomes, researchers can swiftly determine several key metrics such as accuracy, precision, recall, and F1 score. These metrics are imperative for identifying the strengths and weaknesses of a particular model and making appropriate adjustments as needed.
2. Feature Selection: Contingency tables aid in identifying significant features for incorporation into machine learning algorithms. By examining the associations between variables and the target outcomes, data scientists can pinpoint strong predictors that should be integrated into their model. This process ultimately enhances the algorithm’s predictive capabilities and overall performance.
3. Data Transformation: Occasionally, it becomes necessary to convert categorical data into numerical format, particularly when working with machine learning algorithms. This is where contingency tables play a crucial role – they facilitate the transformation of categorical data into numerical values based on frequency counts and other relevant statistical methods, supporting the seamless execution of the model.
4. Associative Analysis: As a fundamental component of associative statistical analysis techniques, contingency tables enable researchers to determine the strength and significance of associations between categorical variables through methods such as Chi-square tests or Cramér’s V coefficient. A deeper understanding of these relationships allows researchers to make informed decisions when building and tuning machine learning models.
5. Hypothesis Testing: Contingency tables form the backbone of various hypothesis testing methods. They lend a helping hand in analyzing the independence or dependence of categorical variables, leading to meaningful conclusions about the population under study. For instance, they can be used to establish whether an observed relationship between two variables exists by chance or represents a genuine underlying relationship.
Contingency tables are a versatile and powerful technique that plays an integral role in the advanced stages of machine learning and statistical analysis. By offering insights into model evaluation, feature selection, data transformation, associative analysis, and hypothesis testing, they significantly contribute to the development of robust and accurate models for any given problem.
Utilizing Contingency Tables in Machine Learning
As machine learning continues to advance and expand its scope, contingency tables have become a vital tool for efficiently processing and analyzing categorical data. By allowing researchers to visualize the relationships and dependencies between different factors, contingency tables play a crucial role in the development of effective machine learning algorithms, as well as in the validation and evaluation of predictive models.
Feature Selection and Model Evaluation
In the world of machine learning, one essential application of contingency tables is in feature selection and model evaluation. When working with multiple features, it becomes necessary to determine which ones are significantly associated with the outcome variable. By creating contingency tables for each feature against the outcome, researchers can assess their potential relationships and perform statistical tests like the Chi-squared test to measure these associations. As a result, only the most relevant features are included in the analysis, thus improving the accuracy and efficiency of the predictive model.
Association Rule Mining and Decision Trees
Contingency tables are also instrumental in uncovering associations and patterns among categorical variables in data mining tasks, such as association rule mining. In this process, contingency tables serve as a foundation for deriving frequent itemsets and generating strong association rules, ultimately helping to identify relevant and actionable insights for businesses, organizations, or researchers.
Additionally, contingency tables contribute to the effective construction of decision tree models in machine learning. By quantifying relationships and interactions between variables in decision nodes, researchers can select the most impactful features and structure the tree in a way that optimizes the model’s predictive performance.
Final Thoughts on Contingency Tables
While this section provides a glimpse into the power of contingency tables in machine learning, it is important to remember that they are only a small part of a larger analytical toolbox. Complementing contingency tables with appropriate statistical tests, visualization techniques, and machine learning algorithms will further enhance your ability to make informed decisions based on your data.
As an expert in the field, consider growing your knowledge in contingency table analysis to advance your skills in handling categorical data. This tool, when used effectively, can significantly improve your ability to develop robust machine learning models and extract meaningful insights from a wide range of data sources.
FAQ – Contingency Table Machine Learning
A contingency table is a table that summarizes the relationship between several categorical variables simultaneously. It lists several variables and their frequencies in simplified form.
Contingency tables are also known as crossovers, two-entry tables or cross tabulations.
Contingency tables can be used to compare frequency of occurrence, significance tests, unweighted totals or sample sizes, statistical characteristics such as means and medians, and net subtotals.
Contingency tables are widely used in survey research, business intelligence, engineering and scientific research.
The standard elements of a contingency table include multiple columns, significance tests, net subtotals, percentages / averages and unweighted sample sizes. Marginal frequencies are a sum of each table row and column, and the total number of observations can be found in the conjunction of Sum (1) and Sum (2). In a contingency table, row subgroups are sometimes called “stubs” and columns “banner points” or “cuts”.
A contingency table, also known as a crosstab, summarizes observed frequencies to describe the relationship between two categorical variables. Contingency tables are useful for analyzing frequency distributions of categorical variables. The article provides an example of using a contingency table to examine the relationship between lung cancer rates and state residency, and suggests using a chi-square test to analyze the data.